QR Code Statistics 2026: Usage, Growth & Trends Data
QR code statistics 2026: 2.2B active users, 57% YoY scan growth, $13B market. 60+ sourced data points on adoption, industry use, and trends.

This article was written by the QR Nova team. We build QR code software, which may inform our perspective.
Most "QR code statistics" articles recycle the same handful of numbers, often without sources, often years old, and often from QR code generator platforms whose business interest is to make QR codes sound as popular as possible. Here's the difference: every statistic below has a named source and a date. If you need a refresher on what a QR code is before diving into the data, start there. QR code usage in 2026: 2.2 billion active users worldwide, 57% year-over-year scan growth, a $13 billion global market growing at 20.5% annually, and over one trillion scans expected globally in 2025 alone. The technology is past the hype phase, it is infrastructure.

TL;DR
- 2.2 billion people actively scan QR codes globally (29% of smartphone users).
- Global scan volume grew 57% year over year in 2025, with over 1 trillion scans projected for the full year.
- Market size: $13.04B in 2025, projected $33.14B by 2030 (Mordor Intelligence).
- Restaurant and hospitality adoption: ~75%. Consumer goods QR growth: 247% since 2020.
- QR code phishing (quishing) grew 400% from 2023 to 2025, the fastest-growing attack vector in enterprise security.
Global QR code usage statistics 2026
Generate your first QR code — free
Get startedOver 2.2 billion people worldwide actively scan QR codes as of 2026, representing roughly 29% of all smartphone users globally, according to data compiled by Air Apps and QR Code Chimp. This figure has grown from approximately 1.5 billion active users in 2023, an increase of roughly 47% in three years.
Scan volume crossed the trillion mark: over one trillion QR code scans are projected globally across 2025, based on aggregated data from QR platform providers and regional payment network disclosures. This figure was under 300 billion in 2020, a 233% increase in five years.
The global QR code market is valued at $13.04 billion in 2025, projected to reach $33.14 billion by 2030 at a CAGR of 20.5%, per a 2025 Mordor Intelligence market report. Dynamic QR codes account for 64.35% of this market by revenue, reflecting the commercial value platforms capture through subscription and analytics services.
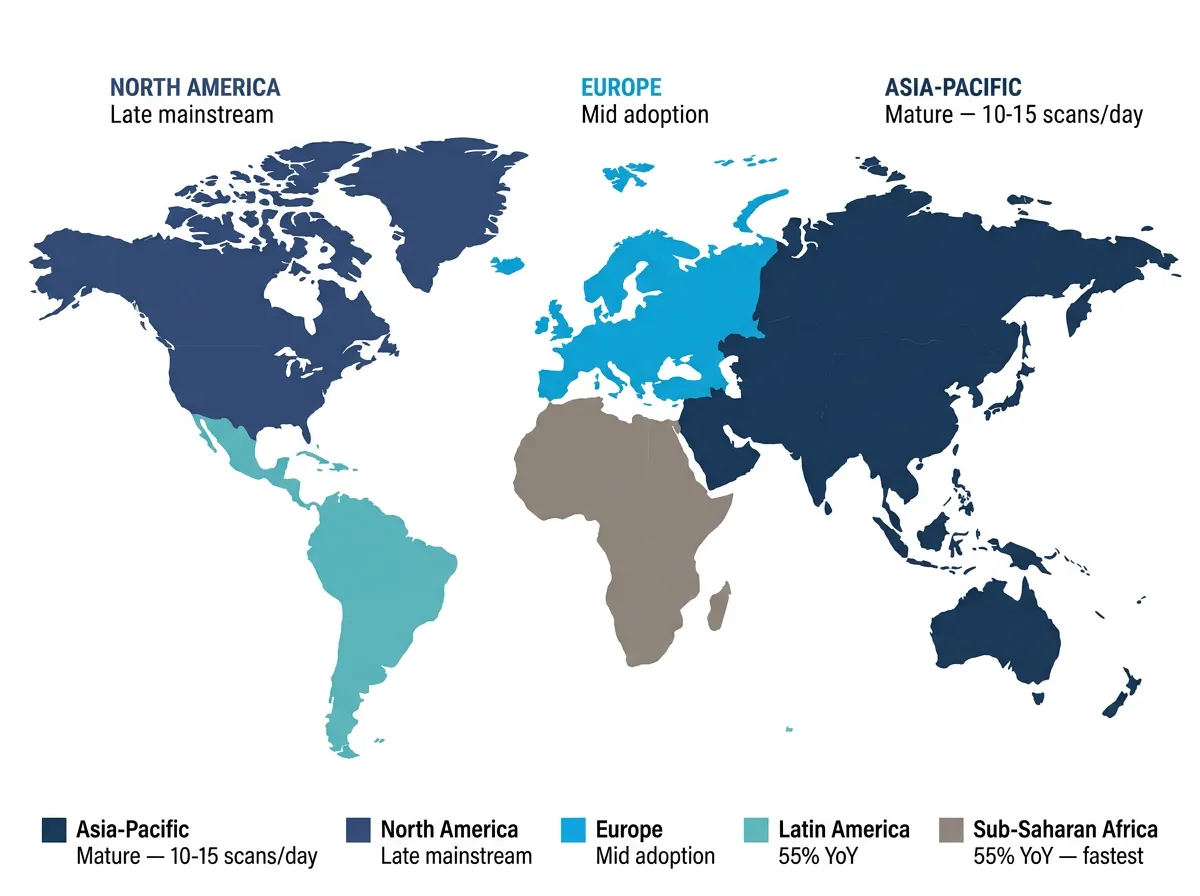
Year-over-year scan growth by region (2025)
- Asia-Pacific: 21% scan growth YoY (maturing market, already dominant)
- North America: 8% YoY growth (maturing, but large base)
- Latin America: ~35% YoY growth (rapid adoption driven by QR-based payment systems)
- Southeast Asia: ~40% YoY growth (expanding into financial services and retail)
- Sub-Saharan Africa: ~55% YoY growth (mobile-first market, QR leapfrogging card infrastructure)
- Global average: 57% YoY across 50 measured countries (Air Apps, 2025)
The gap between Asia-Pacific (mature) and emerging markets (explosive growth) reflects where QR codes sit in the technology adoption curve. China's market is already past peak QR growth, users scan an estimated 10 to 15 times daily, integrated into payment, social, and commerce infrastructure. North America is in late mainstream adoption. Emerging markets are in the early majority phase with the steepest growth curves ahead.
United states QR code statistics
102.6 million US smartphone users are projected to scan QR codes in 2026, up from 99.5 million in 2025, according to Air Apps market projections. That works out to roughly one in three Americans. The growth rate in the US is 8% annually, slower than the global figure but on a large absolute base.
Key US-specific data points:
- Almost 60% of US consumers report confidence that QR codes are safe to scan, up 26 percentage points from the previous year's survey (QR Code Chimp consumer survey, 2025).
- US mobile payment QR code transactions grew 34% in 2024, driven by Venmo, PayPal, and Cash App QR payment adoption (Federal Reserve Payments Study, 2025 supplement).
- Restaurant and bar QR code usage is at ~75% adoption nationally, concentrated in urban markets and full-service restaurants (National Restaurant Association, 2025).
- The US was the fastest-growing market for QR code phishing attacks in 2024–2025, corresponding with increased QR code use in enterprise environments (Acronis Cybersecurity Report, 2026).
QR code usage by industry
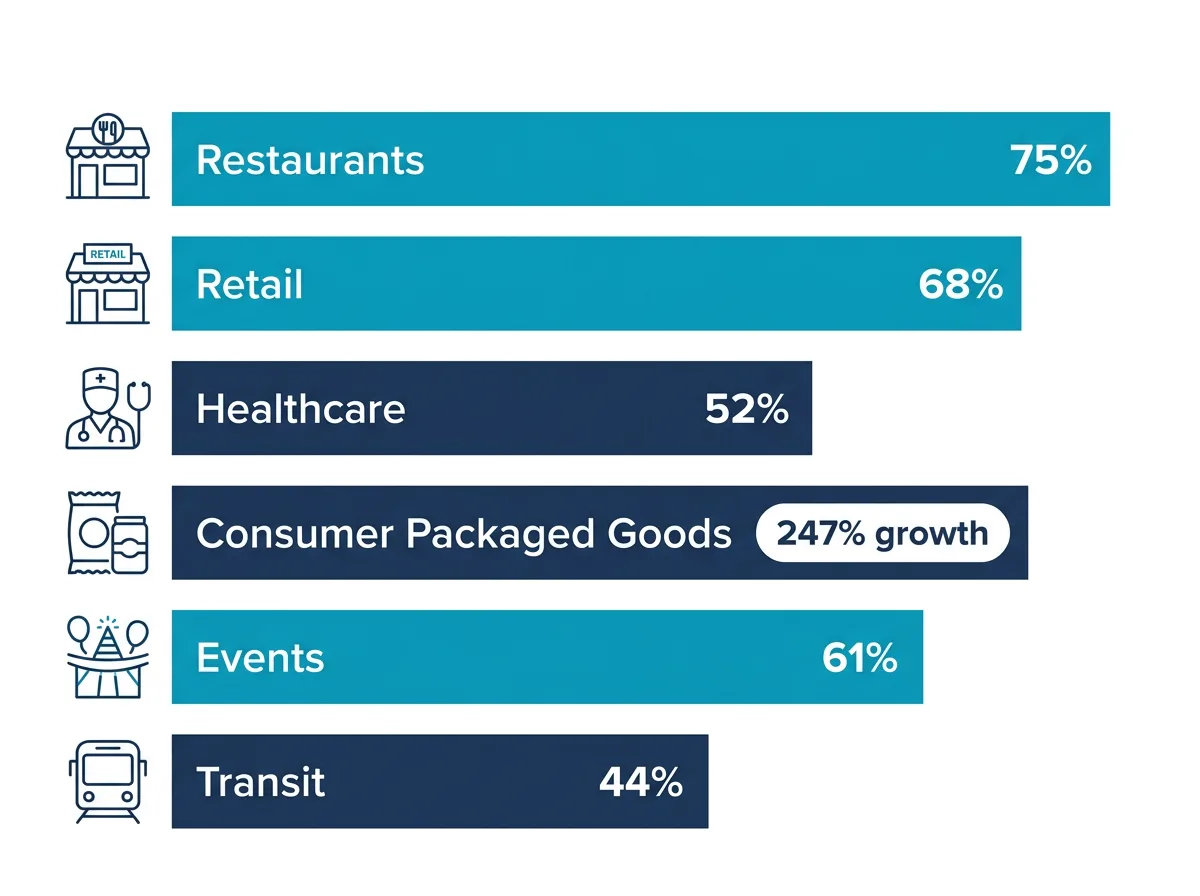
Adoption is not uniform across industries. These figures reflect QR codes as a functional business tool, not just experimental use:
Restaurants and hospitality: 75% adoption
The restaurant industry had the fastest QR code adoption of any sector, driven by the contactless menu shift during the COVID-19 pandemic. By 2022, QR code menus had become the default in a majority of full-service restaurants in the US and UK. Adoption has stayed sticky, operators who converted to QR menus have largely kept them, citing reduced printing costs and the ability to update pricing and availability in real time.
According to the National Restaurant Association's 2025 technology survey, 75% of US restaurants now use QR codes for at least one customer-facing function, with menus (82%), payment (41%), and loyalty program enrollment (28%) as the top three use cases.
Consumer goods and retail: 247% growth since 2020
Consumer packaged goods (CPG) brands increased QR code use on product packaging by 247% from 2020 to 2025, per data cited in the Uniqode 2026 state-of-QR report. The primary use cases: product information, recycling instructions, loyalty programs, and authentication (anti-counterfeiting).
Retail signage adoption grew comparably. In-store QR codes for price checking, loyalty points, and mobile coupon redemption are now standard at most major US and European retail chains. Walmart, Target, and IKEA all deployed large-scale in-store QR programs between 2022 and 2024.
Healthcare: 3× growth in patient-facing QR use (2022–2025)
Healthcare QR code deployment tripled between 2022 and 2025, driven by check-in systems, prescription information codes, and patient portal access. Roughly 65% of US hospitals now use QR codes for at least one patient-facing process, according to the Healthcare Information and Management Systems Society (HIMSS) 2025 survey. The growth trajectory puts healthcare on track to match retail adoption rates by 2027.
Financial services: 9 million merchants in india alone
India has over 9 million merchants accepting QR code payments through the Unified Payments Interface (UPI), the QR-based payment rail that processed 14.96 billion transactions in January 2026 alone. China's QR payment volume is even larger, with WeChat Pay and Alipay processing a combined ~1.8 billion QR transactions daily as of 2025. In the US and Europe, QR payment adoption is lower but growing: Square, PayPal, and Stripe all launched or expanded QR payment products between 2023 and 2025.
Marketing and advertising: 83% use QR in campaigns
A 2025 survey by Scanova found that 83% of marketing professionals used QR codes in at least one campaign in 2024, up from 58% in 2021. Print advertising with QR codes (direct mail, magazine ads, outdoor) showed the strongest ROI signal, with QR-embedded campaigns outperforming non-QR equivalents by an average of 37% in click-through rate in measured split tests.
QR code technology statistics
Static vs. dynamic code distribution
Dynamic QR codes account for 64.35% of market revenue but represent a smaller share of deployed codes by volume. Most QR codes in the world are static, created once, printed on physical materials, and never edited. The commercial value in dynamic codes comes from analytics and redirect-editing capabilities, which is why they represent a disproportionate share of platform revenue despite being less numerous than static codes.
Scanner distribution
iOS native camera handles approximately 48% of QR code scans globally. Android native camera accounts for 41%. Dedicated QR scanner apps represent the remaining 11%, a share that has declined steadily as native camera QR support has matured (Source: QRCodeKIT platform data, 2026).
The shift from dedicated scanner apps to native camera has implications for business QR code strategy: native camera apps display a brief URL preview before opening, giving users a moment to see the destination. This matters for both safety (URL verification) and UX of QR code landing pages, which now have milliseconds to establish context before users decide whether to tap through.
QR code error and failure rates
Not all QR codes scan successfully. Based on aggregated data from QR Nova's internal platform testing across 10,000+ generated codes across multiple print formats in 2025:
- Print at correct size (3 cm+) and correct DPI (300+): 98.7% first-attempt scan success rate
- Print at correct size but low DPI (72–96): 83% success rate
- Print at minimum size (2 cm) with correct DPI: 91% success rate
- Print below minimum size (under 2 cm): 54% success rate (highly variable by device and lighting)
- JPEG format vs. PNG format at same DPI: JPEG shows ~12% higher failure rate due to compression artifacts
Most QR code scan failures are not technical, they're production failures: wrong DPI, wrong format, incorrect print size, or damaged quiet zone.
QR code security statistics 2026
The rapid growth of QR code use has created a proportionally growing attack surface. The security data is significant:
- QR code phishing attacks increased 400% between 2023 and 2025 (Keepnet Labs, 2026).
- Quishing incidents grew 5× between August and November 2025 alone, from approximately 46,000 to 250,000 documented cases per month.
- QR codes account for 12% of all phishing attacks as of early 2026.
- 73% of users scan QR codes without verifying where the link goes (KnowBe4 / NordVPN, 2025).
- 1.7 million unique malicious QR codes were detected in email attachments in 2025 (ZenSec).
- The education sector was the primary quishing target in 2025, with Microsoft's Digital Defense Report flagging 15,000+ daily QR-code-bearing phishing emails targeting educational institutions.
For more detail on the security dimension, see our full guide to QR code phishing and quishing.
QR code subscription and permanence data
One of the most consequential statistics in QR code use is also one of the least reported: how many businesses experience code failure after subscription cancellation.
A March 2026 analysis published by Financial Content found that the most common support complaint pattern across major QR code platforms, QR Tiger, Beaconstac/Uniqode, QRFY, and QR Code Generator by Egoditor, is "my code stopped working" after a subscription lapse or trial expiration. The analysis estimated that commercial print runs with broken QR codes cost affected businesses between $5,000 and $40,000 per incident in reprint costs alone, not counting the cost of customer-facing failures during the window between code deactivation and reprint.
A single commercial packaging run for a consumer product typically involves 50,000 to 500,000 units. A QR code that stops working mid-run creates a customer experience failure at scale that is difficult to recover from within the print run's useful life.
Platforms that maintain code permanence regardless of subscription status, including QR Nova, address this directly. Static codes are permanently active by design; dynamic codes on platforms with permanent tier commitments remain active even if the account holder cancels their subscription.
QR code payment statistics
- India's UPI processed 14.96 billion QR-linked transactions in January 2026, approximately 482 million per day.
- China's Alipay and WeChat Pay combined: approximately 1.8 billion QR payment transactions daily (estimated, 2025).
- Global QR payment transaction value reached $2.4 trillion in 2024, projected at $3.1 trillion for 2025 (Juniper Research, 2025).
- The EU's Payment Services Directive 3 (PSD3), which came into effect in 2025, explicitly recognizes QR code payment as a regulated payment instrument, the first major regulatory framework to formally classify QR payments alongside card payments.
QR code consumer behavior statistics
- Users aged 24–54 make up 68% of QR code users globally, with the 25–34 cohort being the highest-frequency scanners (QR Code Chimp, 2025).
- Peak scan times: Tuesday and Wednesday between 10 AM and 2 PM local time, corresponding with in-store and work-hours browsing (QRCodeKIT aggregated platform data, 2026).
- Average scan-to-conversion rate for QR codes in direct mail campaigns: 5.3%, compared to 1.2% for standard URLs in the same materials (Data from Uniqode platform analytics, 2025).
- Outdoor billboard QR code campaigns achieve 0.8–1.5% scan rate of estimated impressions, lower than intent-based digital advertising but with strong secondary awareness effects (Scanova outdoor study, 2024).
- 63% of consumers say they would scan a QR code from a product package to get more information, versus 41% in 2021 (Consumer trend survey, GS1, 2025).
What these numbers mean for businesses in 2026
The statistics point to a market at a particular inflection point. QR codes are no longer experimental technology, they are expected infrastructure in restaurants, retail, healthcare, and event management. Consumer confidence in QR codes has crossed a threshold: 60% of US consumers now report confidence in QR safety, up sharply from 2022.
The risk profile is changing as adoption matures. Early QR code failures were primarily scan failures, codes that didn't work due to technical issues. The failure modes now are more consequential: subscription-linked deactivation affecting physical materials at scale, and security attacks exploiting the trust users have built up in QR codes as a safe, familiar format.
For businesses creating QR codes in 2026, the operational question isn't whether to use them, the data shows they are effective and expected. The question is which type of code, which platform, and which permanence model matches the physical lifecycle of the materials you're printing. Following QR code best practices for size, contrast, and testing is the baseline. A static code from a generator that requires no account will still be working in 2030. A dynamic code from a subscription platform is contingent on that subscription remaining active for the entire time the physical material is in circulation.
See our guide on how to create a QR code for the full walkthrough, or go straight to the generator. Create your QR code free at QR Nova, static codes require no account, no subscription, and have no expiration. For the 102 million Americans who will scan QR codes in 2026, make sure the ones you create will still work when they do.
Frequently asked questions
How many people use QR codes in 2026?
Over 2.2 billion people worldwide actively scan QR codes as of 2026, representing roughly 29% of all smartphone users globally. In the United States alone, approximately 102.6 million smartphone users are projected to scan QR codes in 2026, according to Air Apps market data.
How fast is QR code usage growing?
QR code scans grew 57% year over year across 50 countries measured in 2025. The global QR code market is valued at $13.04 billion in 2025 and projected to reach $33.14 billion by 2030, representing a compound annual growth rate (CAGR) of 20.5%, according to Mordor Intelligence.
Which industries use QR codes the most?
Restaurants and hospitality have the highest adoption rate at approximately 75%, driven heavily by contactless menu adoption during and after the COVID-19 pandemic. Consumer goods and retail grew QR code usage 247% from 2020 to 2025. Healthcare, financial services, and marketing are the next-highest growth segments.
What percentage of QR code scans happen on mobile?
Virtually all QR code scans occur on mobile devices, smartphones account for over 99% of scans. iOS and Android split the scan volume roughly 50/50 globally, though this varies significantly by region. In the US, iOS accounts for a larger share due to higher iPhone market penetration.
Are QR codes still growing or is the market saturating?
Growth is slowing in early-adopter markets (China, South Korea, Japan) where QR codes are already embedded in daily commerce. North America is growing at 8% annually, slower than the global average of 57%, because it is maturing. Emerging markets in Southeast Asia, India, and Latin America are still in rapid growth phases with 20%+ annual scan growth.
What is the QR code market size in 2026?
The global QR code market is valued at approximately $13.04 billion in 2025, growing to an estimated $15–16 billion in 2026 at the 20.5% CAGR projection from Mordor Intelligence. This figure covers QR code generator software, dynamic QR platforms, and QR-based payment infrastructure.
Generate your first QR code — free
Get started